
Business reporting that answers zone, tech, and client questions
Generic dashboards tell you revenue went down. These tell you it went down because Zone 4 lost three clients to a move away and rain ate nine visits, which is an answer you can act on.
From gut feel to zone level truth
Every report is cut by the dimensions this trade actually runs on: zones, techs, skip reasons, and client cohorts. When a number looks off, the drill down is one click, not a spreadsheet weekend.
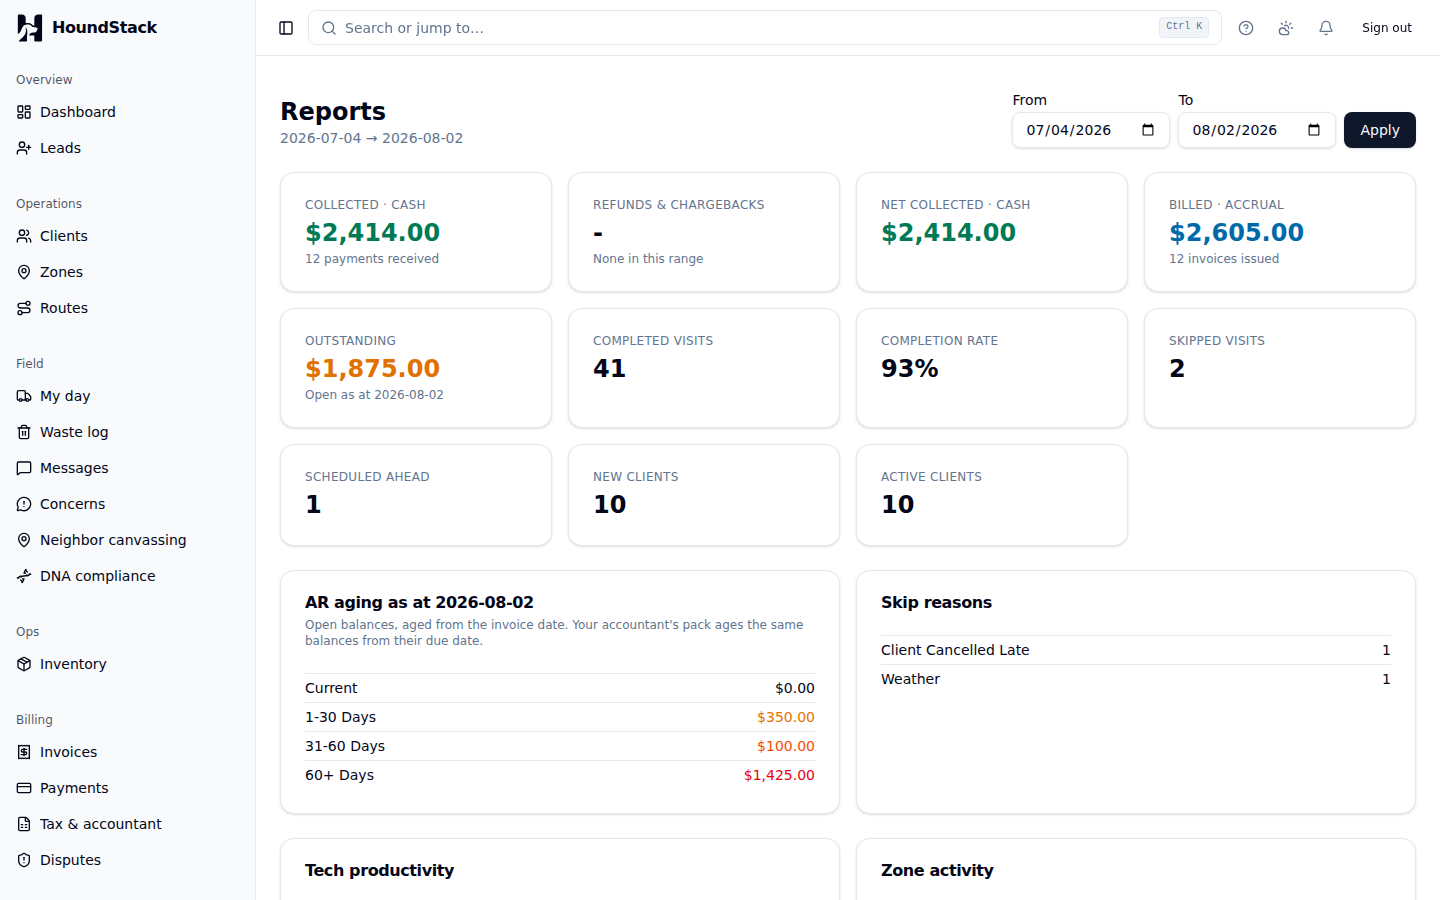
Where the money leaks, in dollars
Receivables bucketed by age so the awkward call happens at 30 days, and every skip priced out by reason. Weather is a cost you can see, and a locked gate has a monthly total.
Rules that watch the business while you run it
Churn risk, zone pricing suggestions and the weekly digest are arithmetic on your own numbers, written down as rules. They are not AI, so the same data always gives the same answer, and every flag comes with the reason behind it.
Churn risk on every client
Each active client gets a score from 0 to 100, worked out from signals like time since the last visit, recent skips, unpaid balances, complaints and declined autopay, with the one or two reasons that drove it. Same data, same score, every time.
Suggested zone pricing, with the rule shown
For each zone, a suggestion to hold or raise the price, based on the last 90 days of completed and skipped visits there. The rule is written out next to it, and nothing changes until you apply it.
The weekly digest
An email every Monday with last week in numbers: visits completed and skipped, money in and still open, new clients and leads, the clients most at risk, and a short list of what to do first.
Every report in the suite
Revenue and outstanding balances
What came in, what is invoiced, and what is overdue, on one dashboard instead of three exports.
Accounts receivable aging
Overdue balances bucketed by age, so the awkward calls happen at 30 days instead of 90.
Skip reason breakdowns
See exactly how much weather, locked gates, and client requests cost you last month, in visits and in dollars.
Tech productivity
Visits completed, time per stop, and photo compliance per tech. Coaching conversations get numbers instead of vibes.
Zone activity and profitability (Growth and up)
Which zones make money and which ones quietly eat drive time. The answer changes routes and pricing both.
Top clients, retention, and lifetime value (Growth and up)
Top clients by revenue, cohort retention over time, lifetime value, and churn driver analysis for the ones you lost.
Plans start at $79 a month
Plans include 1 person on Launch, 5 on Growth, or 20 on Scale, and each extra person is $15 a month within the plan's team-size range. See every tier side by side.
Coming from somewhere else?Switching from GorillaDesk
A named importer with a field mapping preview and a dry run, so nothing is written to your account until you have approved it.
Run your business on it this week
HoundStack is available now. Start today with a 14 day free trial, no credit card, and your first teammate included.
14 day free trial · No credit card · Cancel anytime